|

Web Portal

Our web portal is the true power of the system,
offering customers the ability to view all equipment/sites and their current
status from one location. Key features of the portal include a mapping page, a
details page, a graphing page, a statistics/history page, a control page, a
reports page and a setup
page. Below are some further descriptions of these pages, along with more
information on daily e-mail notifications.

Mapping Page:
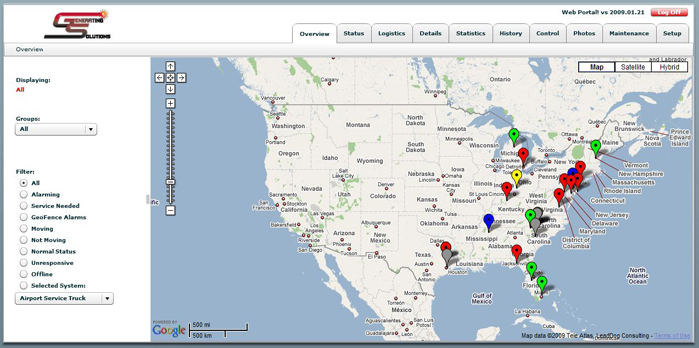
The Mapping Page gives the user a snapshot of
the status of their equipment by location. On this page, you can click the
colored "teardrop" icons to receive the actual status of the equipment
being monitored (pictured below). The mapping page refreshes every
15 seconds to notify you of any status changes. We use color coded
icons to indicate the current status of your equipment.
Green - All Systems Normal
Red - Alarming/Event
Blue - Equipment is Moving
Yellow - Maintenance is Required
Gray - System is Unresponsive
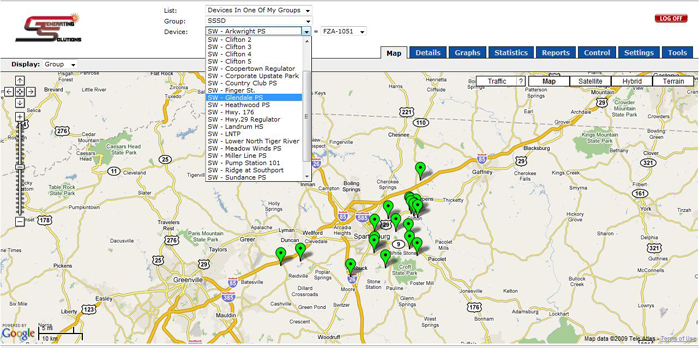
We have recently added the "dropdown list" to
the portal for easier access to single units in your fleet (pictured
below).

Details Page:
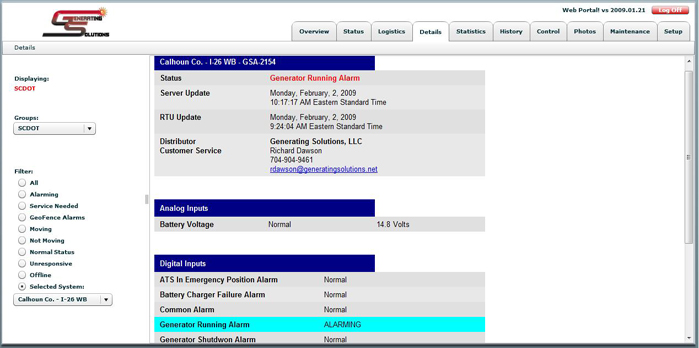
The Details Page allows a user to view the specific
details of the equipment that is being monitored. The current status
is displayed for an easy reference. Also, recent server and Remote Terminal Unit
(RTU) update times are displayed so that you know your unit is
checking in on it's scheduled time. A list of every alarm being
monitored is also available to the user, along with that specific
alarm's current status. If you sign up for daily e-mail updates for
your unit (see Settings Page), the Details page is what you will receive in your
e-mail. Pictured below is a typical Details Page for a generator
set.
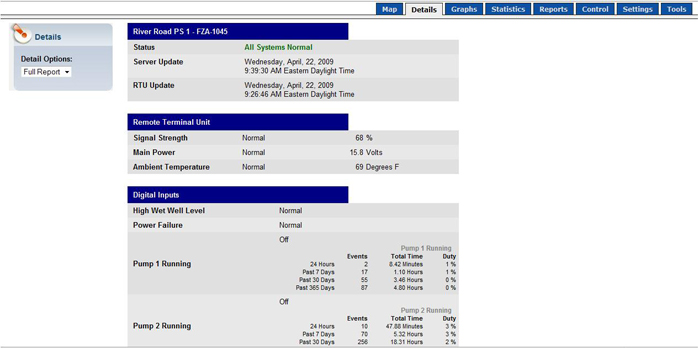
Below is an example of a Details Page for a
typical pump station unit. By going to the
details page, you know right away which alarms are active.

Graphing
Page:
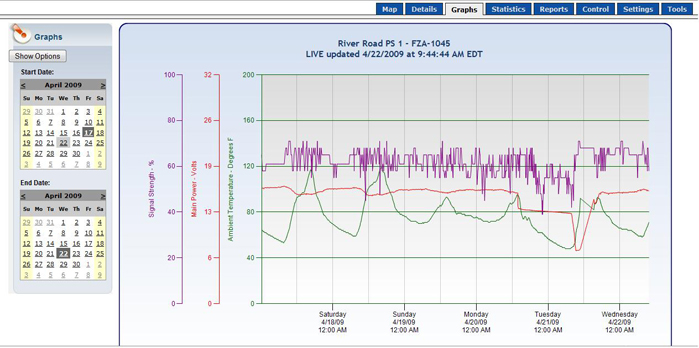
The Graphing Page is generally used for Analog data. In the
example below, we are monitoring temperature, main power (in volts)
and the antennae's signal strength. You may also customize your
window by viewing the statistics from x date until y
date.

Statistics Page:
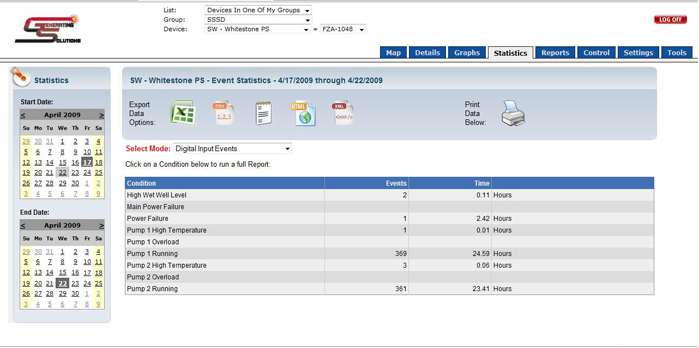
The Statistics Page gives you a history of the alarms and events
on your generator or pump station, as well as the amount of time
that alarm was active during those events. These alarms can also be
viewed from x date to y date. This data can be
exported into an Excel spreadsheet, a Notepad application or simply
organized in an HTML format web page for easy printing and filing.

Reports Page:
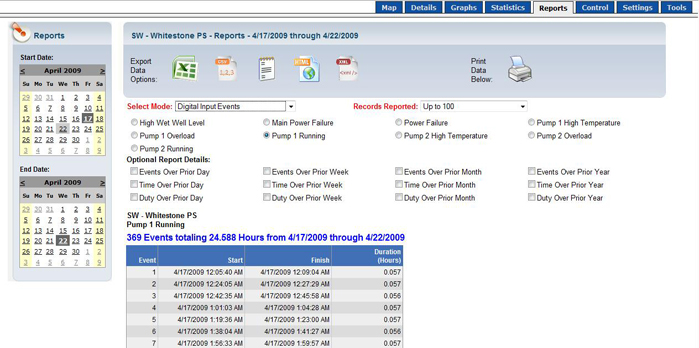
The Reports Page is extremely helpful for logging the history of
your specific alarms. From this page, the user will be able to
select a specific alarm (i.e. Pump 1 Running) and see how many
events have occurred since its installation. You can define the
details of your search by counting the alarm's events, amount of
time the alarm is active, and the alarm's duty. These details can be
defined further to show occurrences over a day, week, month or year.
Just like the Statistics Page, these alarms can be viewed from x date to y
date. This data can also be exported into an Excel spreadsheet, a
Notepad application or simply
organized in an HTML format web page for easy printing and filing.

Control Page:
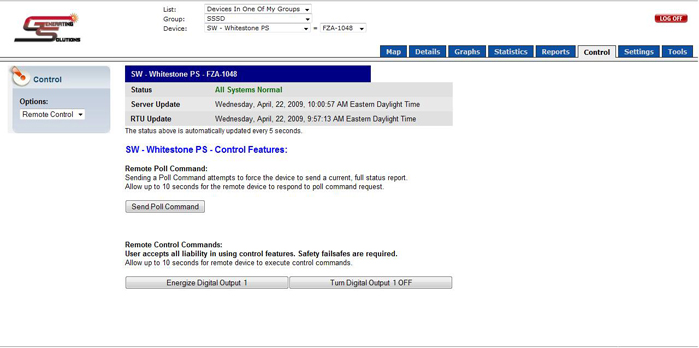
The Control Page allows the user to control the equipment which
they are monitoring. Sending a Poll Command will force the RTU to
check in with the server and send a current, full status report.
Also, users will have the ability to energize (start) and
de-energize (stop) their critical equipment with the click of their
mouse.

Settings Page:
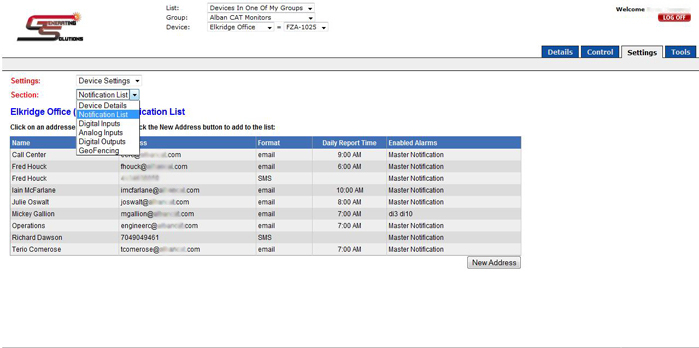
The Setup Tab allows users to set up site-specific information
to include the digital inputs, analog inputs, digital outputs and view
specific details on the equipment they are monitoring. The user will
be able to setup the notification list, to include all alarms to all
specified persons or specific alarms to particular clients (i.e.
fuel supplier only gets "Low Fuel Level" alarm). The user
will also have the ability to edit the site name, alarm
input names and set maintenance alerts based on hours or specific
dates.

Daily E-Mail Notifications:
Users will have the ability to sign up for daily E-mail
notifications. The user will set the desired time they wish for the
RTU to be "polled" and the e-mail of that status to be sent (see
Setup Tab above). For example, say you come into work at 8am. You
may want to set your daily e-mail notifications for 8am, so that by
the time you boot your computer, you'll have the most recent
information on your critical equipment in front of you when you get
to work. Below is an example of a daily e-mail.
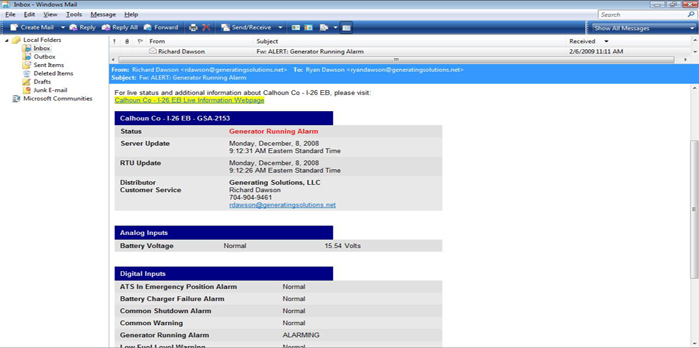
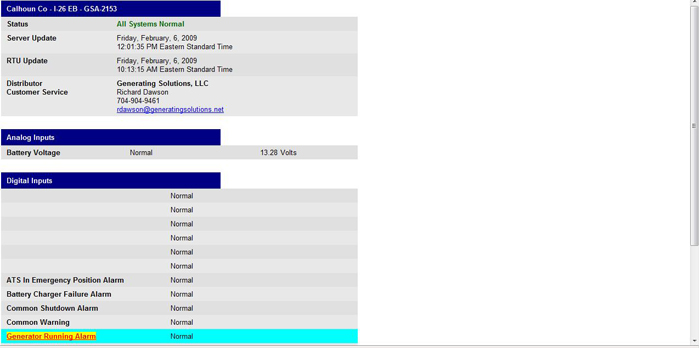
If you click the yellow highlighted link (the
name of your site) at the top of your e-mail, you will be taken to a
live status of your critical equipment (pictured below). Here, you
can click any alarm/event (see Generator Running Alarm below) and
get a detailed history report, date and time stamped, of that event.
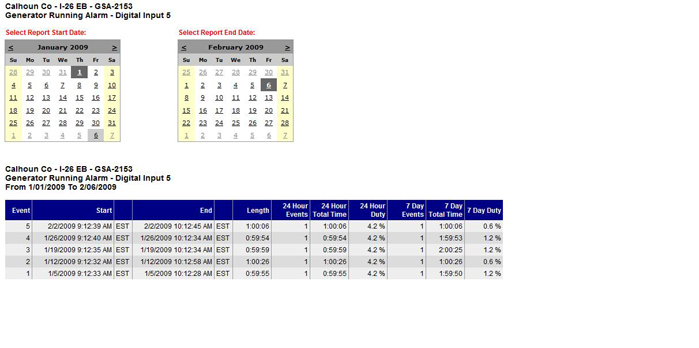
The user is able to view the
alarms/events from x date until y date. In the
following example, we're viewing from Jan. 1st, 2009 to February
6th, 2009. The alarm occurred five times in this period, showing the
start and stop time of the alarm, the length of the alarm, how many
times it occurred in a 24 hour period and how many times it occurs
in a week's time.


|